Our developers have been hard at work over the last month or so, developing what we think is one of the most intuitive and easy-to-use illustration tools around. Let’s give you a quick tour to show you what you can expect.
Tackling an admin headache
Advisers and their staff are weighed down with admin challenges across the advice journey – from double-keying data between systems, to navigating clunky provider interfaces and, you guessed it, creating key features illustrations.
Advisers have told us that, in some cases, it can take nearly twenty minutes to half an hour, just to create a single illustration for a client.
We think that’s far too long. While the calculations that sit behind these documents are highly complicated, the process of inputting an individual’s client and investment details should be anything but. So we’ve set about trying to simplify things.
“In some cases, it can take half an hour just to create a single client illustration”
Easier input…
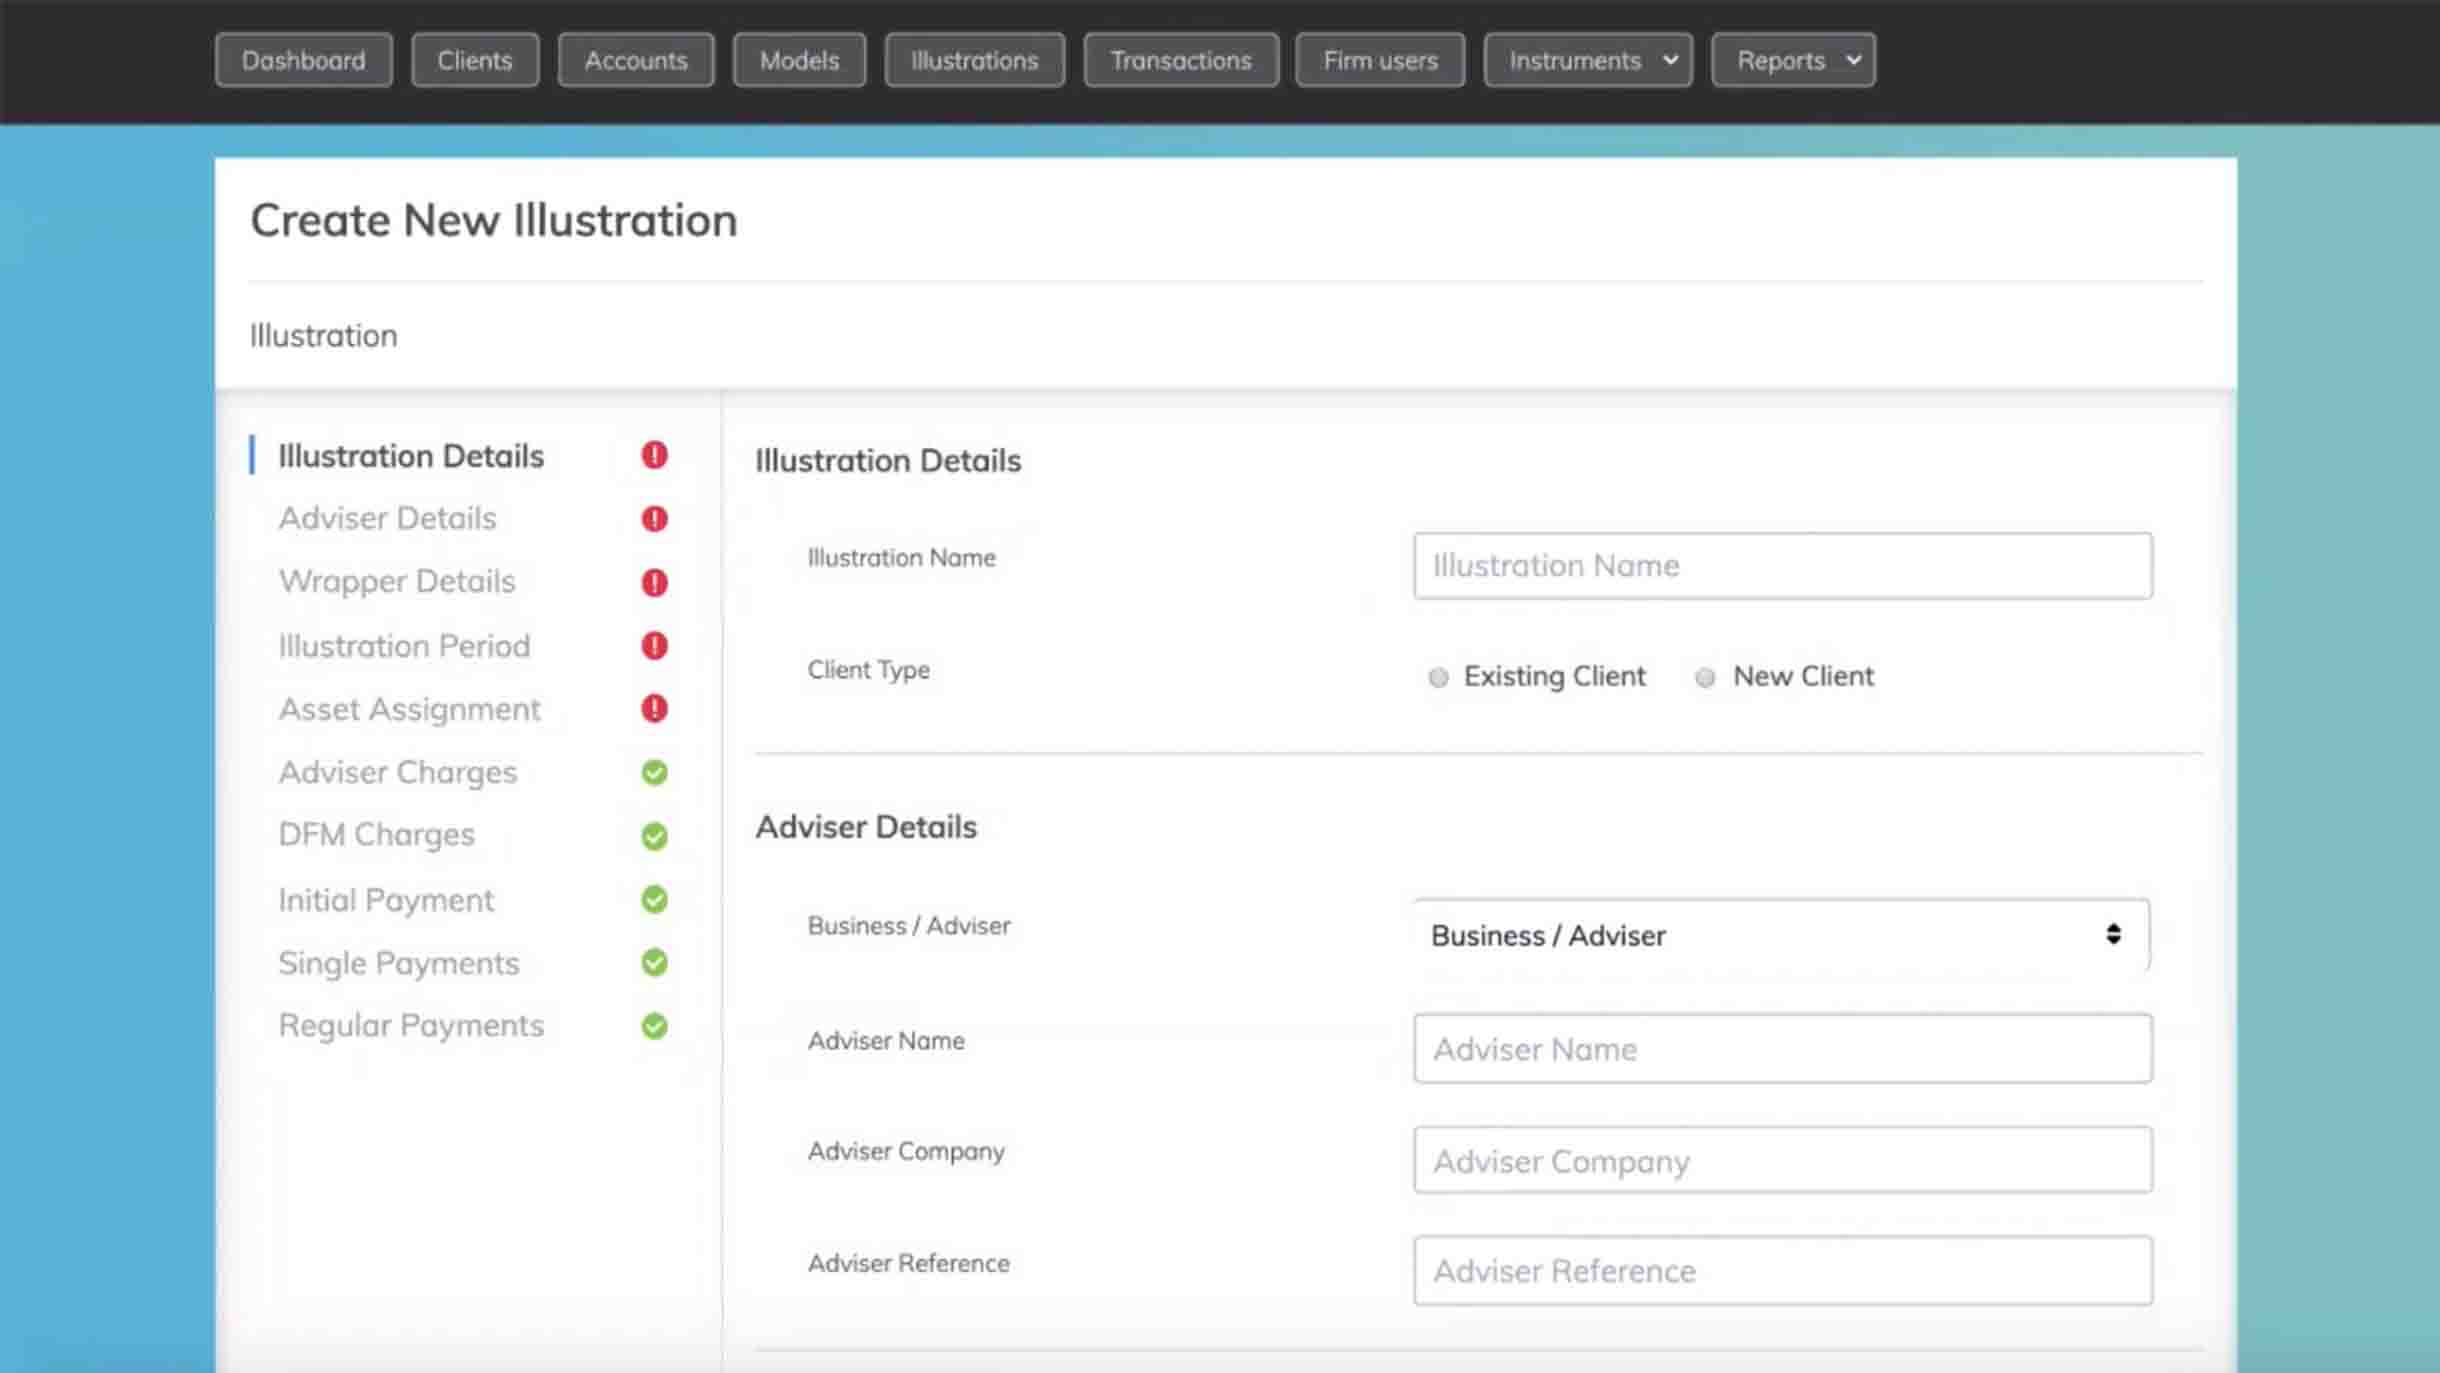
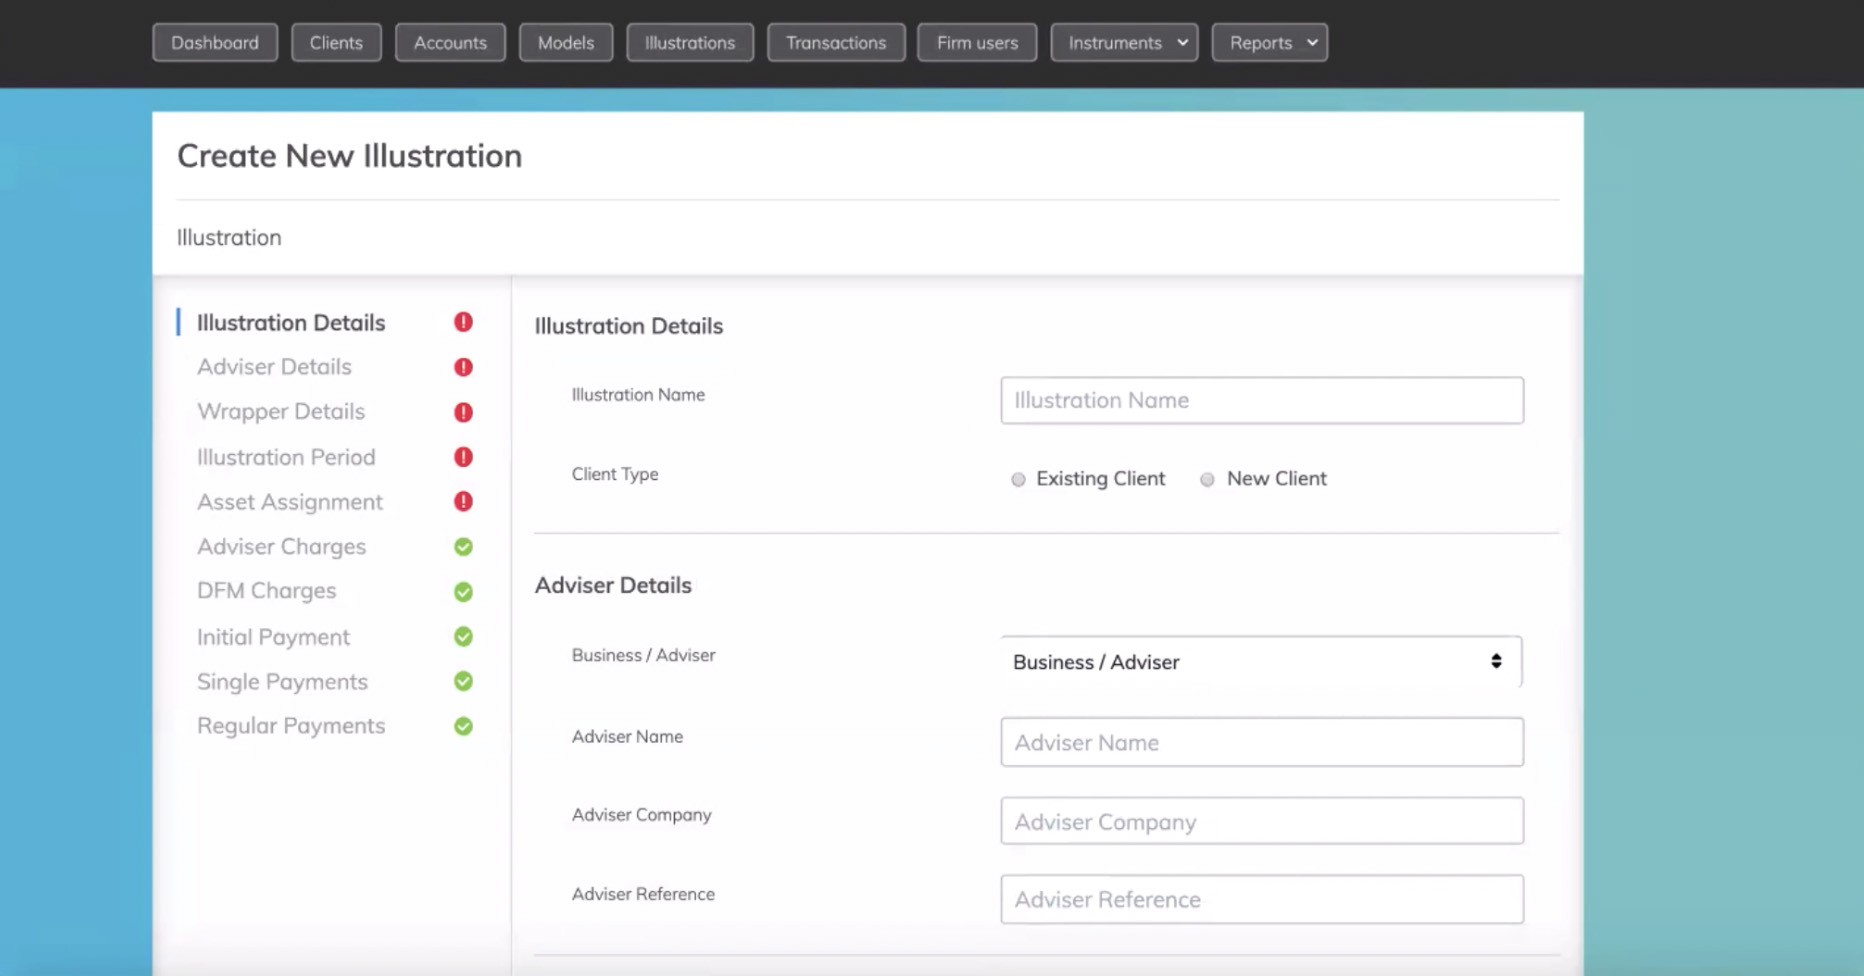
Rather than screen after screen of complex or superfluous input fields, we’ve stripped it back to basics. And we’ve tried to make the journey as easy as possible by…
- Removing the need to input data that’s already held in the system elsewhere – like product or platform fees
- Pre-populating the asset make-up of pre-defined models – so you don’t have to define the assets in the illustration tool itself
- Pulling in all of the asset charges directly from FundsLibrary
Simply input the client and adviser’s details, set the illustration timeframe, define the model, charges and contributions and that’s that. After a quick review, it’s a single button to generate your illustration.
By reducing the journey to a single screen, a review stage and a button click, it should take around five minutes, not 25.
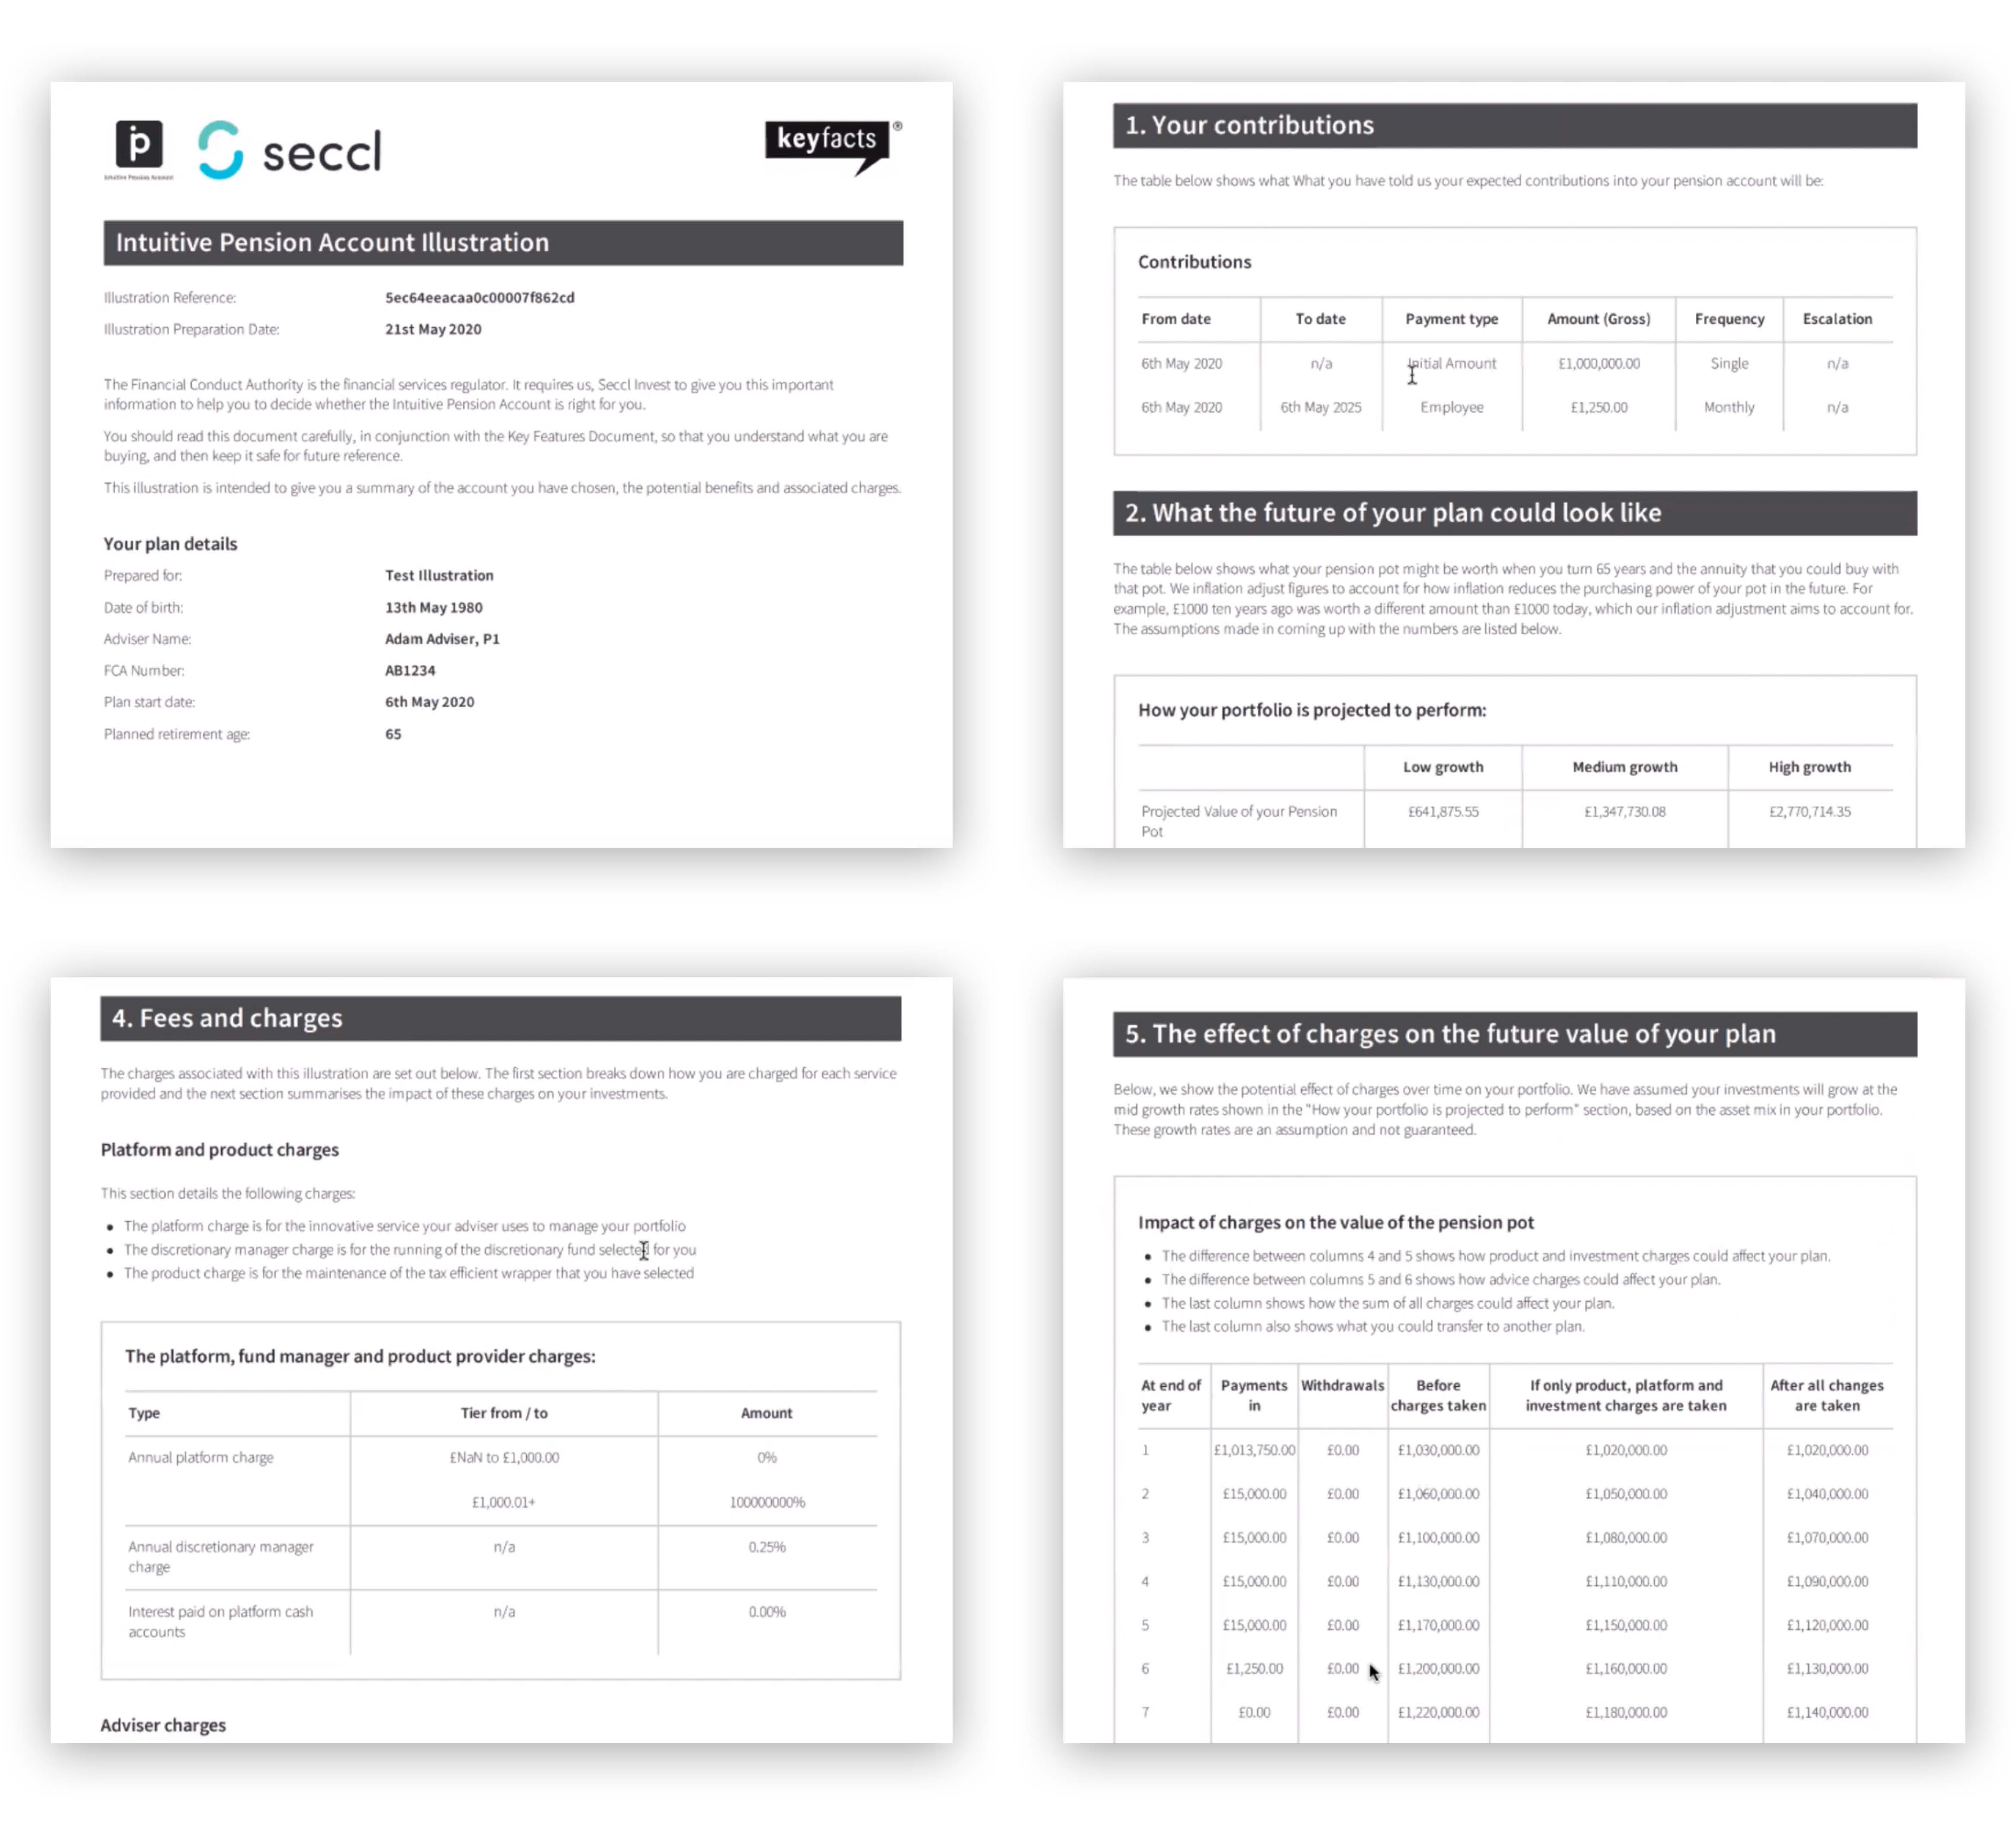
Clearer output…
And what about the end result? We’ve tried to make that as clear and simple as we can, too.
In particular, we’ve chosen to show a clear summary of charges within the illustration itself.
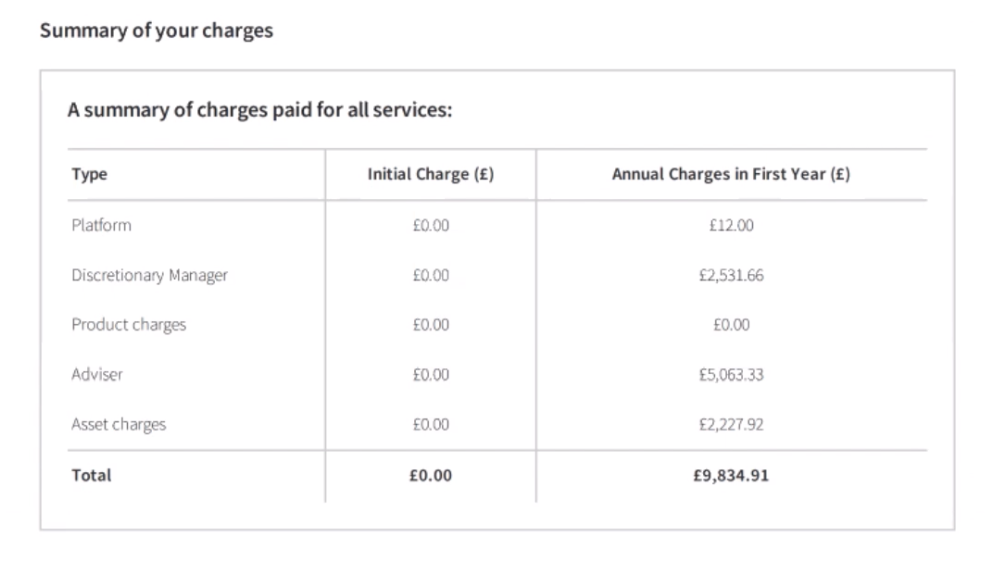
That way you can cover off another regulatory requirement (in this case the costs and charges disclosure mandated by MiFID II), without having to resort to a separate report.
Looking ahead
In time, we’d like to go further in refining the output of our illustrations, to provide meaningful, insightful content for the investors themselves.
That might include a simple explanation of their probability of actually achieving a low, medium or high growth outcome – or some other ‘value add’ visualisations of the core, regulatory-required data.
We’re also working to embed our illustrations tool within the broader client recommendation process, to create a swift, seamless and totally digital process, end to end. Our system already allows you to set up ‘prospect clients’ – so that you can more easily onboard them once a recommendation has been accepted. As such, a key building block is already in place.
In the meantime, we hope we’ve created something that ticks off a key stage in the advice process as simply and intuitively as we can.